Student Fees and Tuition at NSHE
Where are they and where are they going?
The NSHE Chancellor’s Committee To Recommend Board Action On FY 2025 Salary Increases is reportedly considering student fee increases to cover a portion of budget shortfalls for the 2024-2025 year. To put any such proposals into context, here we compare student fees and tuition at NSHE with other public state institutions. We also discuss where fees are headed under the NSHE Predictable Pricing Program, which was established in 2019 and indexes student registration fees to the Higher Education Price Index.
There are various ways to measure and compare student fees and tuition among states. The National Center for Education Statistics compiles averages for the 50 states. The chart below shows average in-state undergraduate tuition and required fees for full-time students for public four-year institutions for 2020-2021 (the most recent available data). The cost for Nevada’s students ranks third-lowest among the fifty states and only above Wyoming among western states. NSHE offers incredible value for students—average tuition and fees are $6434/year31% below the national average of $9375/year.

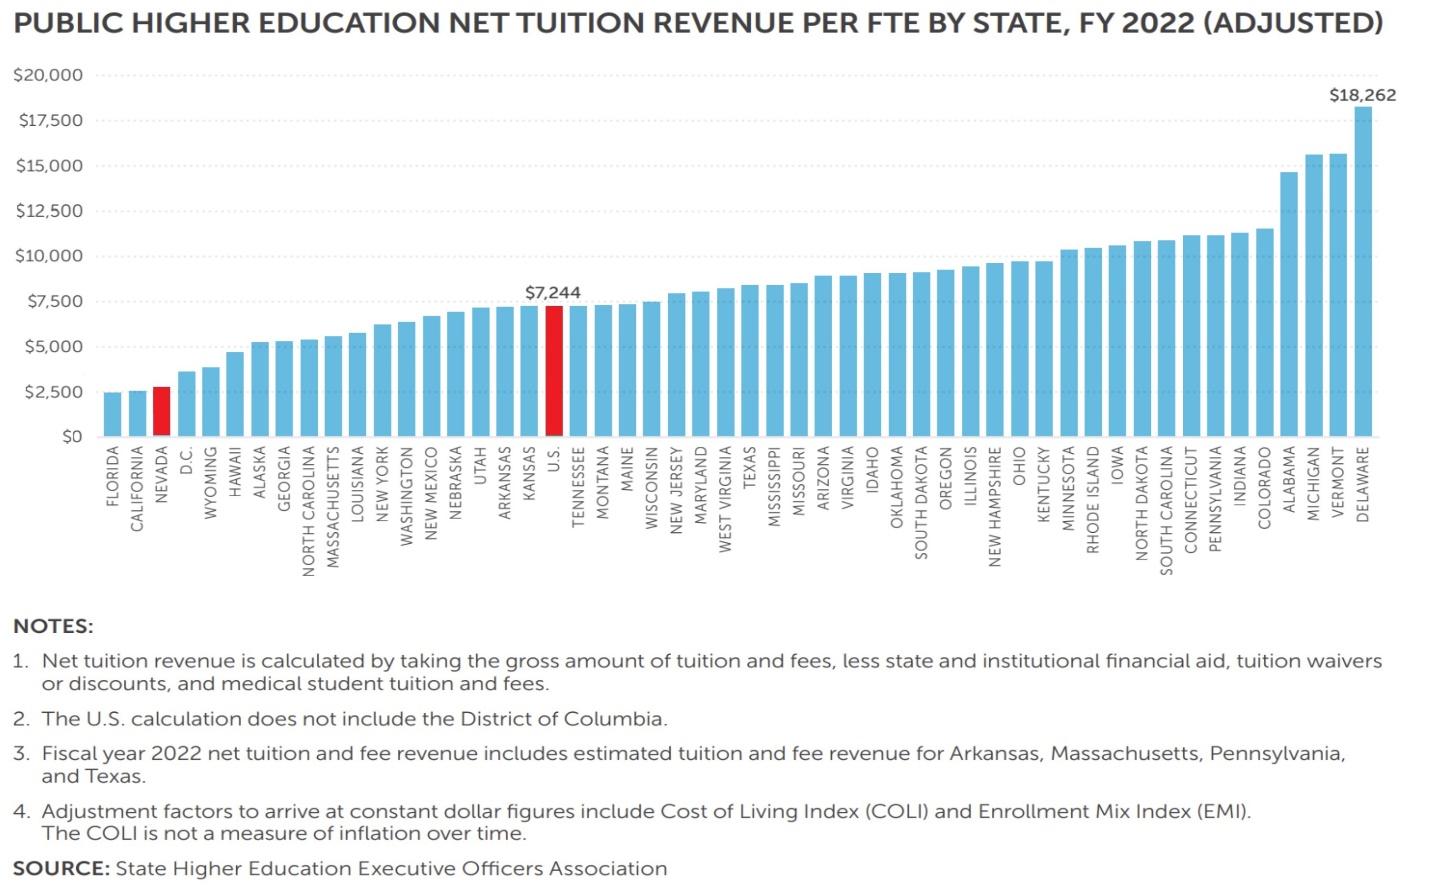
Another measure is the net revenue from tuition and fees, which subtracts state-level financial aid and grants from the gross tuition and fee revenue, compiled by the State Higher Education Executive Officers Association (SHEEO). The chart below shows 2021-2022 state averages (adjusted for the mix of 2-year and 4-year institutions) per FTE. The state rankings are scrambled after state financial aid is taken into account, but Nevada also ranks third-lowest in net revenue from students, at $2,793 compared with the national average of $7,244. Not only are our tuition and fees relatively low in the first place, but Nevada is quite generous with our state financial aid programs including the Guinn Millennium Scholarships, Silver State Opportunity Grants, and Nevada Promise Scholarships.
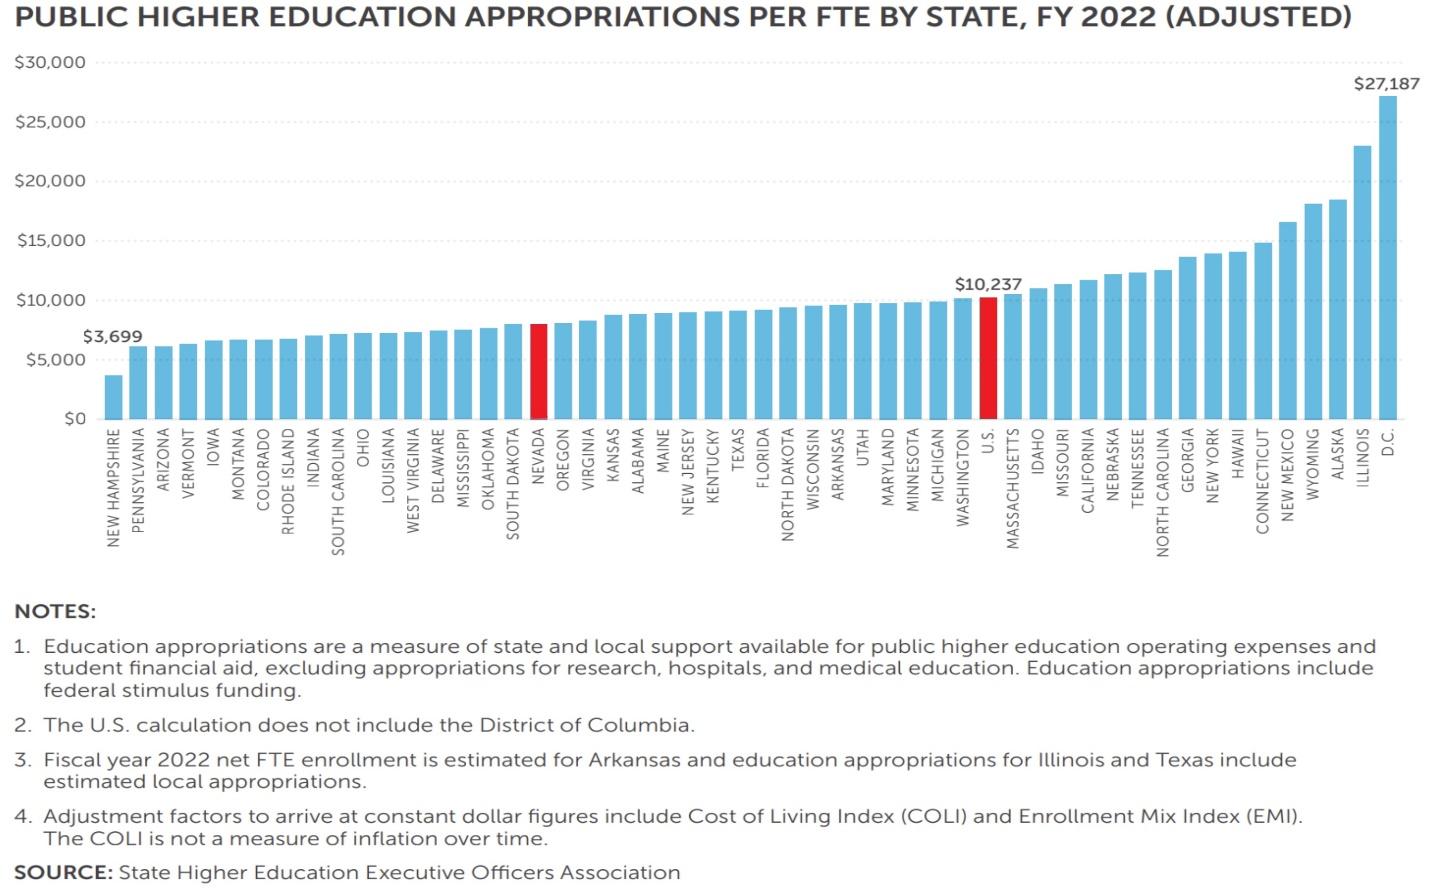
Does Nevada’s low student costs arise from high state funding of higher education? Not so much! The SHEEO chart below shows state funding per FTE for FY2022 including both direct appropriations and student financial aid. At $8,022, Nevada's higher education appropriations per FTE including financial aid are 22% below the national average of $10,237 and ranks 34th.
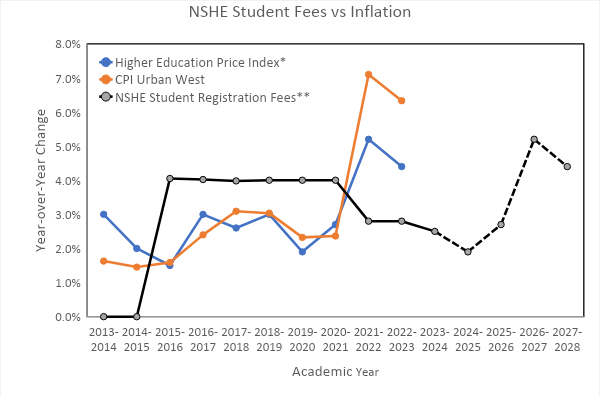
In 2019, the Board of Regents established the Predictable Pricing Program (PPP), which indexes future registration fees and tuition to the Higher Education Price Index (HEPI) published by the CommonFund. The NFA chart and table below compare the annual percentage changes in UNR/UNLV registration fees (the percentages are nearly identical for all institutions and for lower- and upper-level and graduate courses) with HEPI and the Consumer Price Index (Urban/West) from 2013 to present, along with future increases under the PPP. Under predictable pricing, registration fee increases are set for four years ahead based on the most recent HEPI year. Since the HEPI numbers come out with about a 9-month delay after a fiscal year, that results in a five-year lag in adjusting for current inflation. So students won’t start paying for the high inflation of the past two years until 2026-2028. In fact, the annual percentage increases in student fees went down in 2021-2024 just as inflation spiked to historically high levels. After inflation, per-credit registration fees have lost purchasing power by 8.5% just from FY2021 to FY2024. Since student fees have to cover about 35% of the NSHE instructional budgets, the ability of the institutions to provide services and pay its staff is diminished as costs go up rapidly.
|
|
Annual Change
|
|
Fiscal Year
|
Higher Education Price Index*
|
Consumer Price Index (Urban West)
|
NSHE Student Registration Fees**
|
|
2013-2014
|
3.0%
|
1.6%
|
0.0%
|
|
2014-2015
|
2.0%
|
1.5%
|
0.0%
|
|
2015-2016
|
1.5%
|
1.6%
|
4.1%
|
|
2016-2017
|
3.0%
|
2.4%
|
4.0%
|
|
2017-2018
|
2.6%
|
3.1%
|
4.0%
|
|
2018-2019
|
3.0%
|
3.0%
|
4.0%
|
|
2019-2020
|
1.9%
|
2.3%
|
4.0%
|
|
2020-2021
|
2.7%
|
2.4%
|
4.0%
|
|
2021-2022
|
5.2%
|
7.1%
|
2.8%
|
|
2022-2023
|
4.4%
|
6.3%
|
2.8%
|
|
2023-2024
|
|
|
2.5%
|
|
2024-2025
|
|
|
1.9%
|
|
2025-2026
|
|
|
2.7%
|
|
2026-2027
|
|
|
5.2%
|
|
2027-2028
|
|
|
4.4%
|
|
*FY2023 HEPI August Forecast. **UNR/UNLV Undergrad. Predictable Pricing Program established 2019.
|
Analysis by the Nevada Faculty Alliance 10/2023.
Update 2/11/2024: The final Higher Education Price Index for FY2023 published in December 2023 shows an increase of 4.0% over FY2022 (vs 4.4% from the August 2023 forecast).
Update 8/9/2024: First chart with NCES data corrected to include missing Florida. Based on IPEDS classifications, NCES counts all seven NSHE colleges and universities as 4-year institutions (two research universities and five baccalaureate colleges).